
Hi all! I’m proud to announce my new project: MbedSysview. I hope it will be a big help to those of you making more complex and/or multithreaded applications.
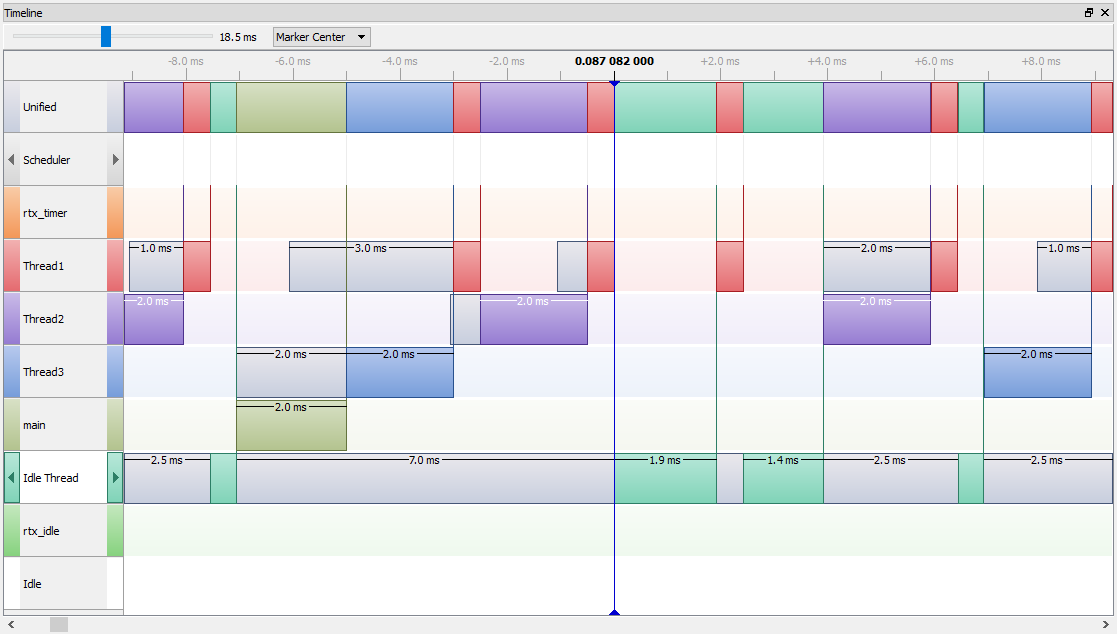
MbedSysview is a library that connects the Mbed OS task scheduler to the SEGGER SystemView profiling & analysis software. SystemView is an amazingly useful tool which shows a complete picture of all task executions, thread switches, and other events of interest in your application. It works by having code running on the target log messages to a low-overhead buffer when events such as task switches occur. These events are then read out over a J-Link debugger and processed by the host application to generate a complete picture of activity on the device. The entire system is extremely efficient and can log tens of thousands of events per second with microsecond timing accuracy.
What Can MbedSysview Do?
- Show all the thread activity in your application
- Profile thread executions and other events of interest with microsecond accuracy and very little overhead
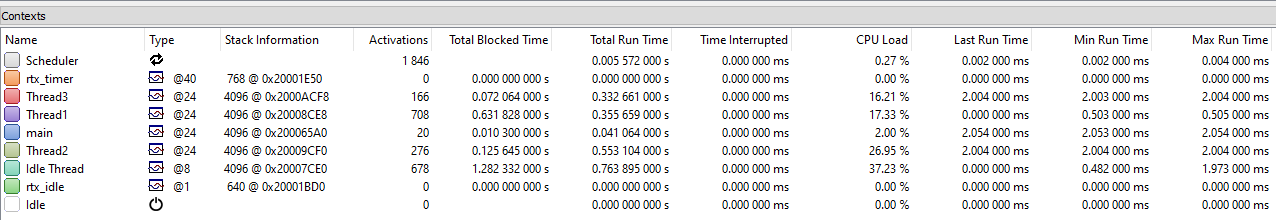
- Display aggregate statistics, such as how much CPU each thread is consuming and how long it runs for on each execution
- Be extended to display custom information, such as markers for events and printouts from the application
- Provide an extremely handy way to visualize and debug resource issues on embedded systems!
What you Need to Use SystemView
- MCU that is supported by SEGGER J-Link
- Any standalone J-Link debug probe, or a dev board with a J-Link On-Board
- Many Mbed boards, such as STM32 Nucleo boards, can have alternate firmware loaded that converts their debuggers into a J-Link On-Board. Instructions for Nucleo boards
- License for SEGGER SystemView. SystemView is free for educational and hobby use. For commercial use it costs roughly $1000 per seat.
Downloading and Setting Up the Library
See the GitHub page.
Basic Usage Example
Once you have the library building with your project (see GitHub link above), integrating MbedSysview is easy. All you need to do is create an MbedSysview object (it can be on the stack or global), then call begin() on it near the start of your program. That’s it! SystemView can now connect to your application and record events.
A basic example main would look like:
#include <mbed.h>
#include "MbedSysview.h"

MbedSysview sysview;

int main()
{
	sysview.begin();

	// optional: wait for viewer to connect if you want to capture the start events
	//sysview.waitForViewer();

	// start your threads...
	// do stuff...
}
For a more complete example, see examples/ThreeThreads.cpp in the GitHub repo. This is the code used to generate the screenshot at the top of the page.
Using Markers
One of the coolest features of SystemView is markers. Markers allow you to attach custom labels to specific events and time periods in the SystemView trace. Markers are shown on the timeline view along with the threads, and are a great way to add some extra detail to the trace of your application.
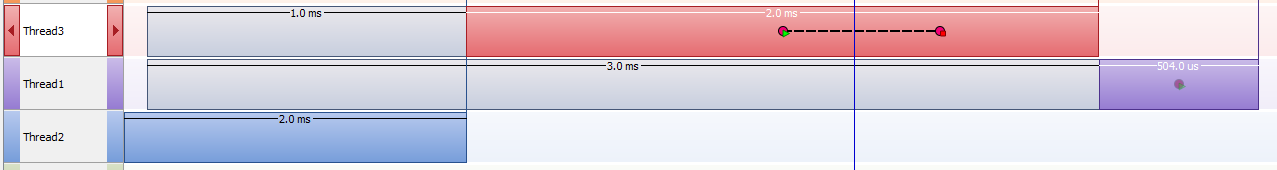
This shows what markers look like on the timeline. A time range is marked on Thread 3, and a single event is marked on Thread 1.
Creating markers with MbedSysview is easy. With vanilla SystemView you need to manually assign unique IDs to each marker and register them all from a specific callback, which can be a pain especially when integrating together multiple pieces of code that use them. However, I used the power of C++ constructors to automate this away! Simply constructing a SysviewMarker object will perform all the setup needed to get it to show on the timeline.
To create a marker, all you need to do is instantiate a global SystemView marker object with your name of choice:
#include "SysviewMarkers.h"

SysviewMarker myMarker("My Marker");
Then, when you want to show it on the timeline, you can just call:
myMarker.markStart();
To mark the end of a range, you can then call:
myMarker.markEnd();
As always, see the docs on this class for more details!
Issues? Questions?
Please post questions here, and if you think you’ve found a bug, post to the GitHub issues page.
Anyway, I hope this library makes your debugging life easier!