In the source system_clock.c there is a check in SetSysClock() with an assertion:
error("SetSysClock failed\n");
But when enter in this condition (by forcing) there is nothing at the serial port about error information and the code stops.
if I go to mbed_error.c I see that something is executed when:
#ifndef NDEBUG
...
#endif
I already tried #undef NDEBUG in the c-file or “target.macros_add”: [“NDEBUG=1”] in the target_overrides but no effect. In that stage a printf is also not working.
There is nothing to find about the correct use of NDEBUG and how to make error information visible in case of debugging.
I do not know exact answer to your question but I suppose you are struggling with wrong clock settings.
I do not know what exactly you expect you will see but when the code reach this line that means that you have wrong clock settings and every attempt (when you have active all 3, then the board can try one by one) above failed, nothing more. So you need to step into clock settings and check which HAL function returned zero. That tell you which part of settings is probably wrong.
In official is just MSI I suppose you fill another from CUBEMX according to your board.
I’m not struggeling with the clock settings anymore but just wanted to know how you can read the error messages if they would be reached. I see error(…) at several places in the code but how to turn on/off these messages? Just to know because when I have to debug something else i’ts handy to know the procedure. Otherwise the controller is just hanging and you don’t know where and why.
In those links I don’t see any info how to use it. NDEBUG is somewhere defined by default? Do you have to adapt the Cmake file? You set it on and off per module or only globally? Will it work with stdio with the speed and pins defined in your config? Only questions about something looking very essential.
How I already wrote it is about build profiles. There exist debug, develop and release profile and the NDEBUG should be probably set automatically set when you chose release profile.
Results are not constentent.
Between each test I also did a hardware reset:
Compile with error(“Test\n”) and no debug option → hanging
Compile with error(“Test\n”) and debug option → hanging
Compile with //error(“Test\n”) and no debug option → Hello world
Compile with //error(“Test\n”) and debug option → Hello world
In the opposite direction I get Hello world until the second line.
It means the behavior of using the debug option is following the last result when compiling without debug option.
To be honest I never used profiles but maybe is necessary to re-compile whole project (I do not know if this is happening automatically when you change the profile in ARM Mbed).
I tried that with MbedCE because I do not use any Mbed offline solution anymore, just KeilsStudioCloud for some help to others.
// I placed this directly to main immediately after a printf with a Start string
error("Test\n");

// Console output with Debug profile
Start!

++ MbedOS Error Info ++
Error Status: 0x80FF0100 Code: 256 Module: 255
Error Message: Fatal Run-time error
Location: 0x8006DC7
Error Value: 0x0
Current Thread: main Id: 0x20002B44 Entry: 0x8006AF5 StackSize: 0x1000 StackMem: 0x20001B20 SP: 0x20002A9C
For more info, visit: https://mbed.com/s/error?error=0x80FF0100&tgt=NUCLEO_F446RE
-- MbedOS Error Info --
Test

// Console output with Release profile
Start!

// Console output with Develop profile is same like first one (Debug)
In all cases the program hangs of course and is re-builded (not clean) and recompiled.
Can you put the error line on the same location that I did? In the clock config. I think if this error is called before uart is initialized that nothing happens.
Important to know: The default profile is ‘develop’ when no --profile option is given in the command.
If you are using --clean, only the relevant folder is cleaned. It means --clean with --profile debug, the folder debug is rewritten and the folder develop is untouched.
That’s the cause of the strange ‘memory’ behavior.
In development profile I see debug() and error() messages.
In debug profile I see debug() and error() messages.
In release profile I see none of them, but firmware hangs.
This is only working when putting debug() and error() messages in main function as test.
If you put error(“Test\n”) when entering the SetSysClock in system_clock.c you see no error message in all cases. Even if I put a printf(“Test\n”) at this location, the firmware hangs.
So what is the sense to put an error in the code error(“SetSysClock failed\n”) in system_clock.c?
What’s the reason that printf() and error() is not working in system_clock.c?
It looks like you cannot execute error() before the call of mbed_rtos_start();
I have different results. If I put the error(“Test\n”) in main after another printf and compile with debug option I get (as you have) the error in the terminal as expected. If I put error(“Test\n”) in the beginning of SetSysClock funtion, the firmware hangs at that point without anything in the console window. There may be differences in CPU, compiling option etc. I can understand that the error() lines are there to be generic and may work in certain circumstances but this is clearly not always guaranteed.
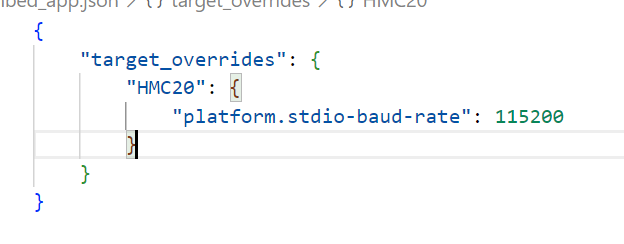
Maybe another reason could be is that you use different pins for stdio (the standard ones?) and I use a dedicated setting.
One of the things I think on is that is may be possible that this error data is coming out to a different pin and once in main to the pin where my FTDI is connected on. I will make a variant of the same HW (more generic) where I can better test it. But I will not loose too much time because it’s a non blocking issue.
I redirected to PB6/7, in my case the default was different. I remember that in my first trial the serial data was coming out somewhere on the usb pins.